Creating a Contractor Dashboard to Drive Smarter Business Decisions
Stop guessing. Learn how to build a contractor dashboard with the right construction KPI tracking to boost profits and make smarter decisions.
Published on Aug 25, 2026

The Power of Centralized Operations Data
A contractor dashboard gives owners one place to peek at profit, labor, backlog, and cash flow, in real time.
With manual tracking, it can end up hiding the problems until they start knocking around margins, schedules, or even customer payments, and then it’s too late.
The best dashboards focus on a small set of high-value KPIs that really support quicker decisions, you know.
When the data is centralized, contractors can turn performance signals into weekly actions instead of those end-of-month, surprise situations.
Running a contracting business without a clear view of performance is a little like managing a jobsite in the dark. A well-built contractor dashboard gives owners a practical way to see what is happening across jobs, teams, and finances in one place.
Instead of waiting around for these scattered reports or trying to dig through spreadsheets, leaders can lean on construction KPI tracking to figure out which jobs are actually profitable, where the labor is slipping, and how fast cash is coming in.
What a contractor dashboard can do that manual tracking cannot
Manual tracking is ok, right up until your business gets too busy to keep each number current by hand. Paper reports, text threads, and split-apart spreadsheets end up slowing things down a bit, and that slowdown leads to small errors. A modern contractor dashboard brings the essential info together in one place so owners can respond sooner, before small issues turn into costly headaches later.
This matters because construction performance is rarely steady from week to week. Productivity output and hours worked can shift pretty sharply across project types and different time windows, and that is one reason the BLS keeps updating construction labor productivity measures, and why owners need near-immediate visibility to manage their own operations [1].
The limits of paper reports, spreadsheets, and disconnected systems
Reports age fast. By the time they’re collected, reviewed, and discussed, a project may already be off track. Spreadsheets can help, but manual data entry increases the risk of missed costs, duplicate line items, and outdated totals.
Disconnected systems tend to make the whole thing worse. During estimating, scheduling, payroll, and invoicing, they run sort of on their own, and the leaders end up without a crisp real-time picture. So it gets harder to notice margin erosion, late payments, and those labor overruns before they start to affect the job.
Why real-time visibility matters for contractors
Real-time data helps leaders spot risk earlier, while also really tightening financial control. The SBA puts forward the need for solid bookkeeping and financial insight so everything keeps running smoother. And contractor dashboards give you access for sharper everyday choices, so you can act with a bit more confidence [2].
How centralized data creates a single source of truth
When all the key numbers end up in one system, the business stops doing that thing where everyone argues over which report is “right”. A central dashboard becomes the single source of truth, which means estimators, project managers, and owners are all using the same facts.
The most important KPIs to include in a contractor dashboard
The best dashboard is not the busiest dashboard. It should highlight a short list of KPIs that directly connect to profit, production, and cash flow. A strong contractor dashboard helps owners focus on the numbers that actually change outcomes.
Construction is a large and economically important sector, and even small changes in output and hours can materially affect results. BLS data show construction makes up a significant share of U.S. employment and GDP, which underscores how important it is for contractors to measure performance carefully [3].
Job profitability, gross margin, and cost-to-complete
Job profitability is the clearest indicator of whether your business is actually making money or just staying busy. Gross margin tells you how much is left over after the direct project costs, while cost-to-complete gives you a sense of what it will take to finish the work you have already sold.
Taken together, these measures help you answer three really critical questions: Is this job healthy? Is it starting to drift? Do we still have enough margin left to safeguard profit? When contractors keep an eye on these figures in a contractor dashboard, they can make more decisive moves about change orders, staffing, and even how they set pricing for the next round of bids.
Labor utilization, productivity, and overtime trends
Labor is one of the simplest costs to underestimate and, at the same time, one of the quickest to get away from you. Utilization shows how much of that paid labor time is billable or productive, while productivity shows how much output is produced per hour; they're not the same view.
Backlog, win rate, and customer payment performance
Backlog, win rate, and payment performance give a general read on future revenue health. With a dashboard, you can stay on top of whether growth is still keeping step with delivery capacity, so it helps with operations in a smoother manner and supports more careful planning too.
Construction KPI tracking that helps owners stay ahead of risk

Good construction KPI tracking is not just about reporting how a job has performed, but it helps you to predict how strong a building is long before it's built. This is a key factor in understanding indicators, since it helps identify the likelihood of risks coming into play sooner rather than later.
In a fast-moving kind of business, this is really worth noting since you cannot do everything from the country because the data of the Kenyan Census Bureau is showing its muscle. Comparing the indicators alone is not as enlightening as the single-source measures for the industry, which makes it very hard to measure the performance directly from the information [4].
Using KPIs to detect schedule slippage early
Often, a minor delay like a certain lag, missed verification, or underperformance may have a quick impact on the whole upstream activity. A planned and actual comparison through the dashboard helps the teams identify the delays early on, and after that, they may correct resources as needed and check into flaws before they result in problems with the client.
Monitoring budget variance and change order impact
Variance in budget gives you a perception of convergence between what you estimated and what has actually been disbursed. A determination of true and beneficial change orders can fluctuate fairly within the scope of margins, protection, and allowed confusion if such changes are not properly documented and priced.
Contractors must look at them both together. Most likely, if he sees that costs are going up and that there have been approved change orders before, it will become clear that profit is also leaking. Provision of a new contractor dashboard must be allowed to help the field adapt and connect the said change by financial impact quickly.
Tracking safety, quality, and compliance metrics
The factors of safety and quality are significant for business, especially through the lens of insurance, rework, reputation, and operating costs. Here, incidents, inspections, punch lists, and compliance are factors that help to discover risks as early as possible. Checking against the production and financial KPIs shows whether a job is really healthy, not just moving fast.
How contractor data analytics turns numbers into action
Raw data alone will not help a business. Value comes from identifying patterns and deciding what to do next. Contractor data analytics is where the strength of data comes in-the power to move owners from having seen data to actually doing something.
With an effective dashboard, executives could see the crews and costs of different project types and parts of work that are going right or wrong. This is how contracting companies use business intelligence for contractors: You get to better decisions more quickly and with less guesswork.
Identifying patterns across jobs, crews, and project phases
Some crews execute better than others. They make it a practice to go over budget in some stages of a project. Analytics, even if the numbers seem insufficient, can disclose such patterns.
More valuable questions emerge whenever those trends become apparent in operations. Is the fault with training, materials handling, crew mix, or project sequencing? A dashboard would not replace a leader's judgment, but it would provide evidence to support the leader's decision.
Comparing current results against historical performance
By providing historical context, we prevent false alarms and blind spots from occurring. One project looks underwhelming as a standalone but may be a significant improvement on work of a similar nature done twelve months ago. On the same token, a project looking incredible is attributed to all those internal metrics.
This is what benchmarking is all about. Contractor dashboards are designed to allow owners to compare current production, margin, and collections to previous jobs. To past months or the particular season of the previous year. Numbers only become meaningful insights due to context.
Using dashboard insights to set priorities each week
Weekly priorities should come from the dashboard, not from whatever is loudest that morning. That is when we would expect our leaders to be focused on where oversight is lacking, so that once data indicate some evidence of troubling labor inefficiencies, payable accounts creeping past due, or backlogs being sheared.
What makes more of what you're talking about, from meetings, is that you just make it shorter. No more spending time hunting for problems, just more time solving them. The dashboard is an actual weekly operating rhythm, not just a reporting tool.
Why business intelligence for contractors leads to smarter decisions

Business intelligence opens their eyes for contractors to look at job results in isolation and glimpse into the bigger picture. Now it relates operational performance to financial pay-offs and offers a basis for very reliable planning.
Business intelligence for contractors helps managers to stop relying on gut instinct alone. When the numbers are presented in an easily understandable manner, an owner can set a better price aside for themselves, an employer can staff better, and it now evidently seems more certain to have a meticulously unicursal plan.
Improving pricing, staffing, and resource allocation
A contractor gets the ability to better price by using bid history to ascertain what job types continually justify high gross margins and which ones do not. In the meantime, staffing is becoming more effective, as with more accurate data, leaders measure how much work capacity the team can handle. On the other hand, resource allocation improves scaling when physical resources of equipment, labor, and subcontractors are assigned based on actual demand.
That is where a contractor dashboard turns into a decision engine that presents itself as a contractor dashboard. Therefore, it will enable owners to substitute guessing in bid preparation with an alignment of price, capacity, and labor with market realities.
Strengthening forecasting and long-term planning
Forecasting gets stronger when your data is consistent. If backlog, win rate, collections, and production history are all visible in one place, it becomes much easier to estimate future revenue and staffing needs.
Long-term advantage is bad as well. Contractors can use long-term trends to make decisions on when to hire, when to invest, and when to stop spending. This kind of planning turns down the volume on noise and contributes to steadier growth over time.
Helping owners respond quickly to changing conditions
Construction stakeholders are always faced with evolving labor costs, material prices, customer requirements, and even weather-related disturbances. You can take action immediately because dropping off the main dashboard helps guide owners on how to respond.
Since the signal is there even before the month is over, leaders can adjust bidding, reallocate crews, or go back to terms of payment while there is still time to have an impact on the outcome. In an unsteady market, speed is the only difference between keeping margin and losing it.
Best practices for creating and managing a contractor dashboard
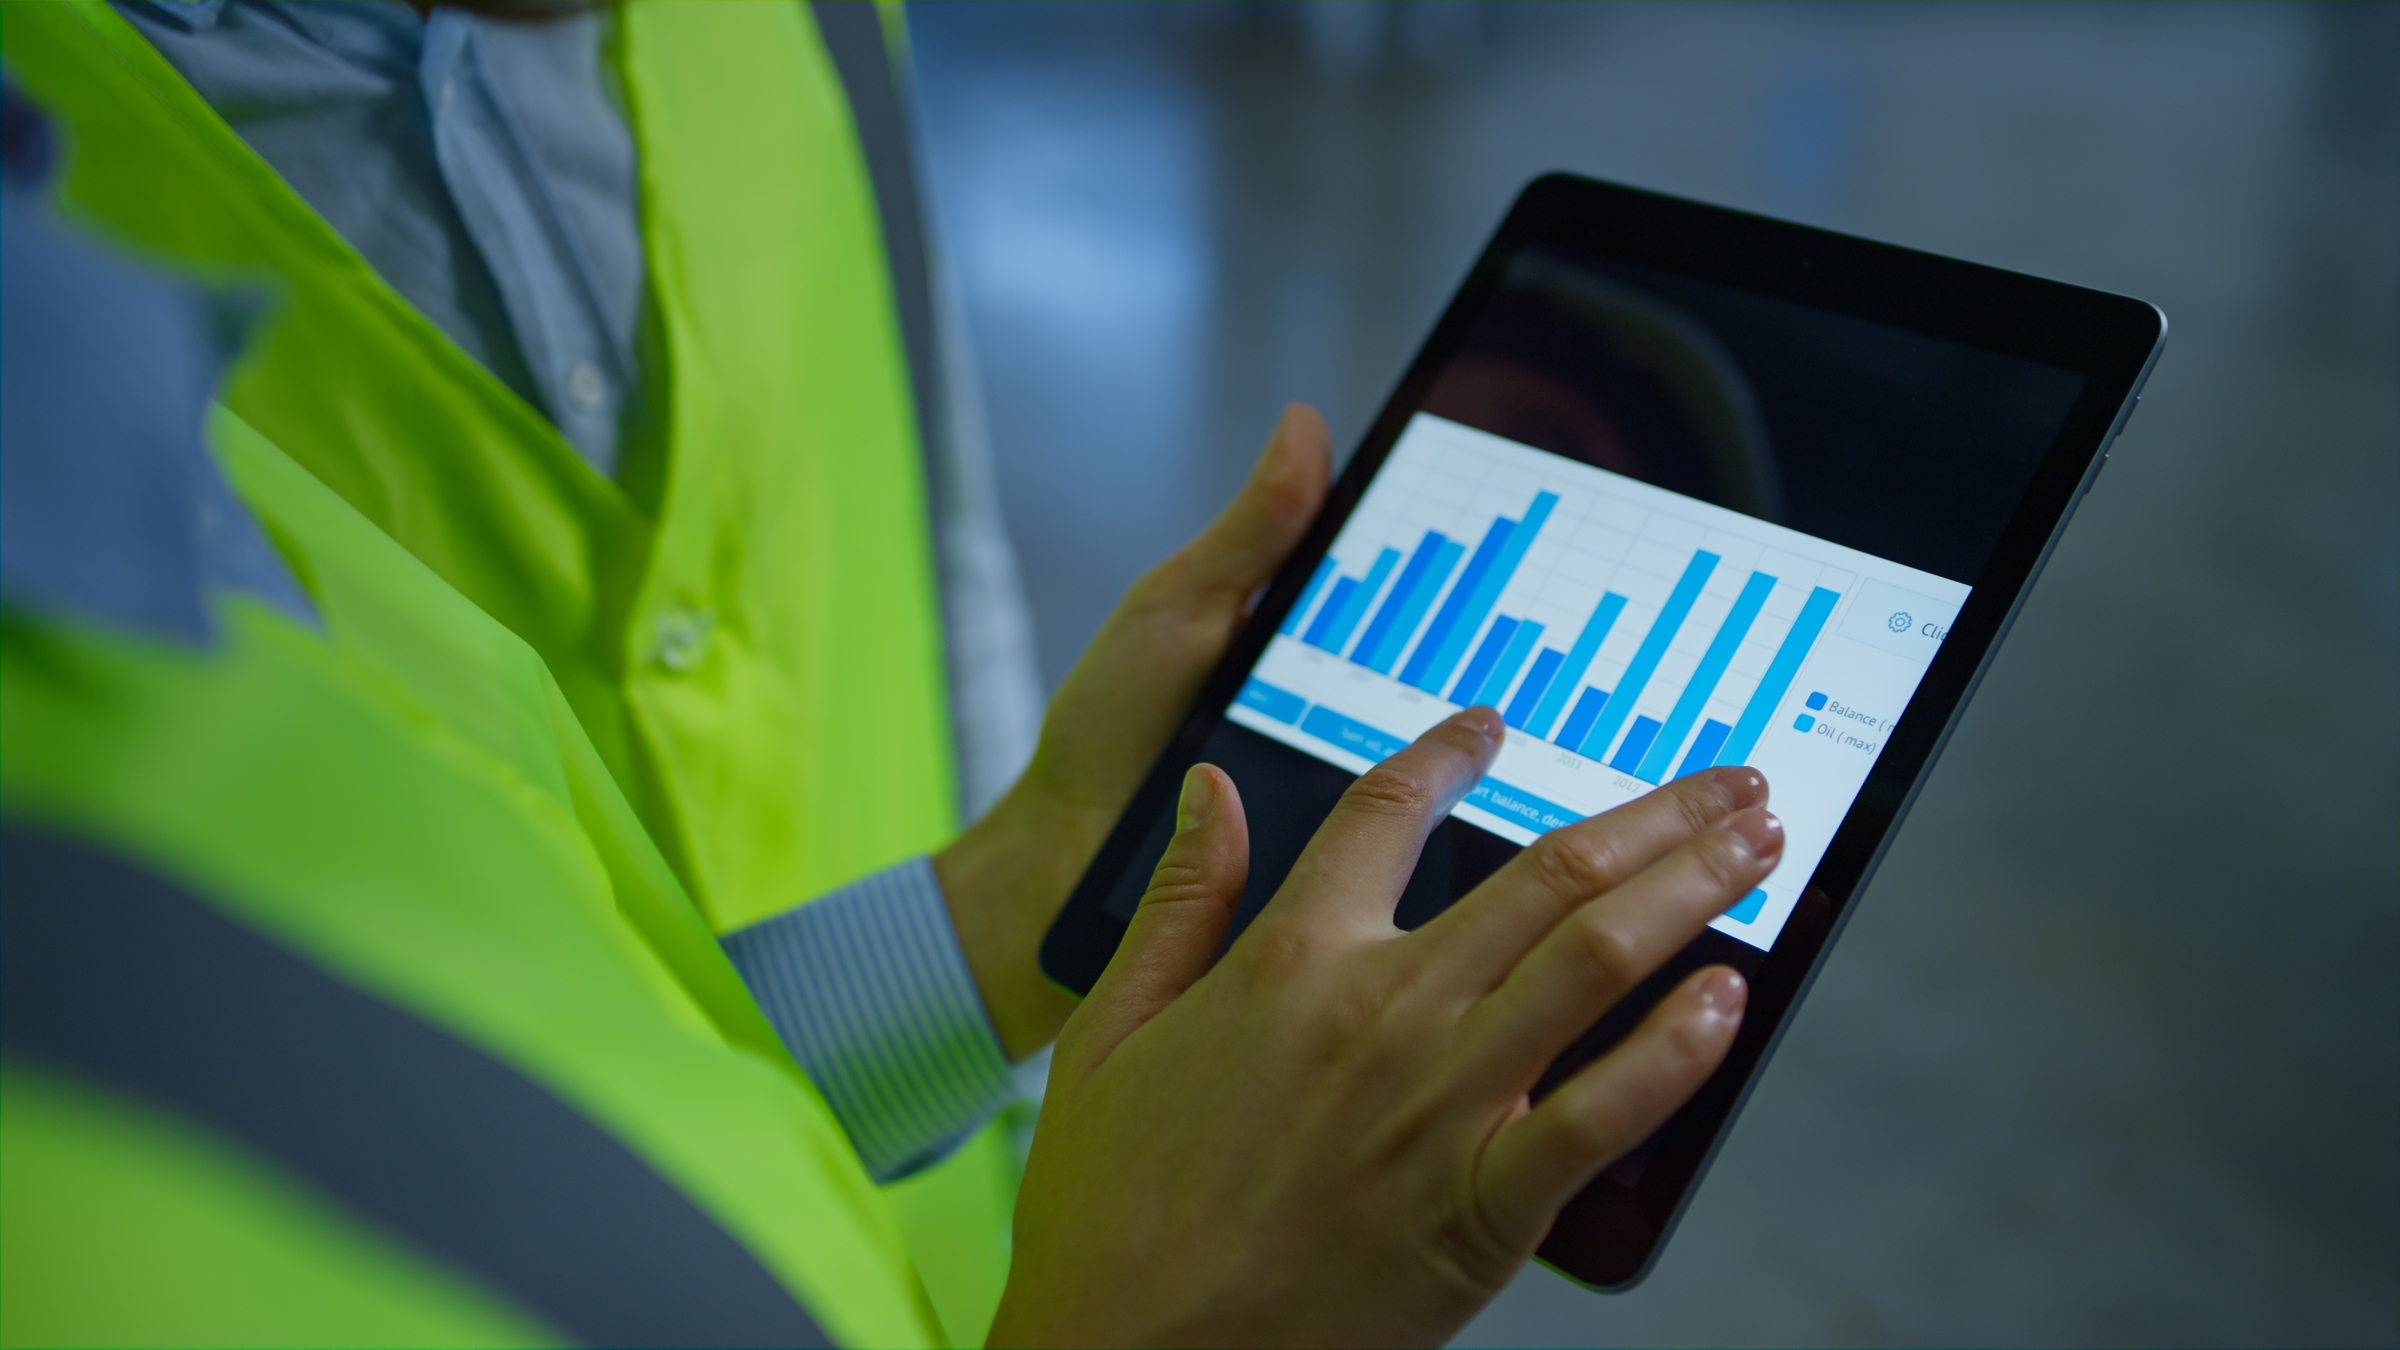
An effective dashboard does require hard work. It's not meant to track everything; it's meant to track the things that matter and can be used by your team. A good contractor dashboard should easily allow itself to be reviewed weekly. It should also be detailed enough to stimulate practical action.
This requires carefully selected KPIs, automatic data collection, and leadership training in interpreting the results. Make it a smart dashboard and assimilate it into the operating system of your company, not just another screen on your notebook.
Selecting the right KPIs for your business goals
Start with your strategic objectives. Target margin, job cost, and cash collection for performance, if profit is the priority. Add backlog, win rate, and crew capacity if growth is the priority.
There should be no vanity metrics cluttering your dashboard. Every KPI should answer a business question you actually would like to solve. If a metric does not drive a decision, then it probably does not belong on the front page.
Automating data collection from key systems
Manual updates greatly slow production, creating more space for error. Once upon a time, numbers from estimates would flow straight to the accounting, scheduling, and payment management tools to keep the charts current without any intervention.
This, in turn, makes the data more reliable. The data comes from the same sources every time, and what leaders see, they trust-it leaves them with less spending on reconciling the rows of numbers. This is one of the biggest advantages of contractor data analytics over spreadsheets for tracking.
Training leaders to review and act on dashboard insights
A dashboard is fully functional only when it is plausibly used by the people using it. Engaging in accountable action involves inculcating reporters into a culture of review, just as supervisors, project managers, and owners harness the power of similar metrics. Thus, accountability is settled by ownership and escalation: dashboards will then begin to be there for useful, not merely tracking, purposes.
For instance, a contractor dashboard for owners is a useful tool to insulate them from the stress of reacting late to become fully operational in leading confidently through suggestions and teamwork on projects so as to render them profitable.
Frequently Asked Questions
What KPIs should be on a contractor dashboard?
The most effective KPIs typically comprise job profitability, gross margin, cost-to-complete, labor utilization, overtime, backlog, win rate, and payment performance. Other performance indicators added by many builders include safety, quality, and schedule KPIs (metrics) to have a view of operational and financial risks in one place.
How often should contractors review dashboard data?
For most businesses out there, their sweet spot is once a week- because it happens so often, most of the time, contractors are able to catch the budget from drifting, labor problems, or the lack of collections quite soon-but so that some real action can still be taken between reviews by the team.
Can a contractor dashboard replace spreadsheets?
Yes. Use a spreadsheet for many reporting and decision-making needs. Spreadsheets could be the best solution for one-off data analysis, although a dashboard might be more convenient for centralized, repeatable, real-time visibility across the business.
How does a dashboard improve construction KPI tracking?
Pulling data from multiple systems into one view that's updated consistently improves tracking, since it becomes easier to compare current performance against budget, schedule, and historical results. Doing so doesn't require spending hours compiling reports.
What is the biggest benefit of business intelligence for contractors?
The biggest benefit is better decision-making. To see trends in margin, labor, backlog, and cash flow in one fell swoop helps owners price more accurately, allocate resources more effectively, and respond more quickly to changes in the business.