How to Use Reporting to Spot Problems Before They Cost You
Leverage contractor reporting to analyze project profitability. Use business performance data to spot capacity limitations before they cost you.
Published on Oct 13, 2026

Using Dashboards to Identify Capacity Limits
Reporting works best when it is consistent, year-round, and tied to real sales and project activity.
The “feedback” component should consist of wins/losses, types of projects, sources of marketing leads, and reasons for results, not just reviews and surveys.
A dashboard is useful for contractors in finding capacity constraints, pricing problems, and channel effectiveness before margins suffer.
When you track the right data, you can move from guesses to measurable financial planning and confident growth goals.
If you want better decisions, start by looking at the numbers you already collect. Contractor Accelerator helps contractors turn everyday activity into clearer insight, which is the foundation of strong contractor reporting.
That means more than reviewing profit and loss statements once a year. It means using sales outcomes, project history, and marketing data to analyze project profitability, detect trends early, and make planning decisions based on facts instead of hunches.
How contractor reporting helps you catch business problems early

Effective reporting will allow you to see what is happening before it costs you anything. As opposed to waiting until the revenues and margins are affected, you can look at the trends and take action when there is still some room to do so.
This is when contractor reporting turns into more than just a bookkeeping activity. In reality, it is a warning signal that you face risks in the form of pricing pressure, sales inefficiencies, and operational inefficiencies. Data collection, market research and competitive analysis are suggested by SBA as part of a structured planning process.
Consistency in tracking the same data all year round allows you to see if the decrease in productivity is a trend or if there is a problem in your processes.
Why year-round data is more valuable than end-of-year guesswork
Annual guessing can distort reality. When year-end statistics come, it might be too late to address pricing, staffing, or marketing issues.
Year-round information helps you understand what’s going on when everything is in motion. If there is a drop in your win rate for a particular service line or if your close rate increases only with the involvement of a certain estimator, you can react right away rather than explain the situation months later. That is the practical advantage of consistent business performance data.
The role of reports in identifying changing business trends
Reporting makes it possible for you to make comparisons between current performance and some pre-defined baseline. This process helps you know whether there is an improvement or deterioration in job volumes, ticket averages, or lead quality.
For contractors, any changes will be reflected in the sales funnel first before being reflected in the profit/loss statement. Any increase in the number of bad leads or decreasing conversion rates will be an indication that something is happening in the market or within your messaging or pricing strategy.
How dashboards make warning signs easier to see
A dashboard consolidates all the most critical signals on one platform so that there is no need to look for them in a spreadsheet. This is particularly helpful when it comes to spot capacity limitations before scheduling becomes chaotic.
The most efficient dashboards reveal patterns by service, source, results, and margins. With their help, owners can identify which projects are worth doing, what channels should be invested in, and where attention is currently needed.
What counts as feedback in a contractor business
There is more than one form of feedback. For a contractor, the most valuable forms of feedback will usually be found in daily operations: what jobs were won, which ones were lost, and the reason behind the prospect choosing to work with a competitor.
That broader definition of feedback creates a more accurate view of the business. When you combine sales data and project data, you begin to see what customers value, what they resist, and what your team is actually capable of delivering profitably.
This is one reason contractor reporting is so valuable. It captures the story behind the numbers, not just the final totals.
Using sales outcomes as feedback, not just customer comments
Every win or loss tells you something. If you consistently win larger remodels but lose smaller repair jobs, the issue may not be demand—it may be positioning, pricing, or the type of customer you are trying to reach.
This is important because sales results give you insights into behavior rather than into opinion. A lost sale provides much more insight than an online review.
Tracking project type, marketing source, and result reason
The best reporting systems track more than just whether a lead converted. They also record project type, marketing source, result reason, and win/loss status so you can compare one segment against another.
Such structure highlights certain patterns. For instance, one marketing channel might provide more estimates, while another one provides fewer leads and more profitable projects. Centralized reporting features make it easier to tie those data points together and see the full picture.
Turning everyday job data into actionable insight
Once there is consistency in your reporting, small details will begin to matter. The loss of a job because it is “too expensive” in one service line might simply be an issue with price, but in another service line it could indicate that you have the job position wrong.
This is why data gathering requires discipline. You do not need to gather everything; you just need to gather the right things in the right way every single time.
Find patterns in win/loss data that explain performance
Win/loss data is one of the fastest ways to understand where your sales process is working. It shows which opportunities fit your strengths and which ones consume time without enough return.
Used well, contractor reporting can turn win/loss records into a practical sales tool. You can improve estimates, refine your targeting, and make better choices about which jobs deserve a follow-up and which ones should be left behind.
According to SCORE, business projections improve when owners use existing or estimated financial data, then compare results regularly to expectations through structured forecasting and review.
Spot when a certain project type wins consistently
This is usually not by chance because there is an underlying cause of why you always win that kind of project. It could be that your team knows the customer, your proposal is well-written, or your prices align with the market.
This could also mean that your prices need to be increased strategically because the market has already accepted a higher price than you are asking for.
Understand why specific jobs are lost on price or positioning
Loss reasons matter because they tell you whether you have a price problem or a positioning problem. If you are losing only because you are “too high,” the next step is not always to discount—it may be to sharpen your value story.
On the other hand, if prospects keep comparing you to a different type of provider, your offer may not be framed correctly. That kind of insight is one of the clearest benefits of disciplined contractor reporting.
Use win/loss trends to improve sales strategy
Based on what comes out of the analysis, it may be determined how the sales process needs to be modified. For example, it might be decided that some services need to take precedence.
Over time, that approach helps you build a more predictable pipeline. You are no longer relying on volume alone; you are improving the quality of the opportunities you pursue.
Analyze project profitability across services and channels

Revenue is not the same as profit, and not every job deserves equal attention. To grow well, contractors need to analyze project profitability by service type, project source, and margin after labor and overhead.
This is where the value of reporting becomes clear. A channel that produces more leads doesn’t necessarily produce the best leads; on the other hand, a less productive channel might produce better-fitting clients.
The SBA also notes that market research and competitive analysis help identify demand, pricing, and market opportunities before you commit major resources.
See which services produce the most profitable work
Some services bring in busy calendars but weak margins. Others may be less frequent yet highly efficient because they require fewer revisions, fewer callbacks, or less labor disruption.
When you review profitability by service, you can stop treating every sale as equal. That allows you to invest more energy in the work that actually supports the business.
Compare marketing sources by project quality and value
Data collected from the sources of marketing becomes very significant when it is compared to the value of the job. The source that delivers cheap buyers may be efficient at first glance, but the source that delivers good quality buyers could be more valuable than that.
That is why business owners should look at both volume and quality. A smarter reporting view shows not just where leads came from, but what those leads turned into.
Use business performance data to guide smarter investments
After you’re able to differentiate source quality, cost, and margins, making investment decisions becomes easier. You may want to invest more money into channels that are creating high-margin leads, or reduce your budget for channels generating low-margin inquiries.
And here is how you use business performance information to grow efficiently. Rather than investing equally, you allocate resources where returns are highest and easiest to achieve.
Use reporting to spot capacity limitations and protect margins

Leverage reporting to identify capacity constraints and defend margins
While growth can sometimes lead to problems by itself, a lack of visibility into capacity constraints can make matters worse. Increased demand is a good thing, but if your team is overworked, it may mean that things start getting pushed past their limits, leading to late deliveries, poor quality, reduced closing rates, and thin margins.
That is why contractor reporting should include workload indicators, backlog trends, and pipeline timing. Those metrics help you understand when demand is rising faster than your ability to deliver well.
Watch for signs your team is nearing its workload ceiling
Overworked teams will give off these signs prior to the situation getting out of hand. Estimations become slower, responses lag behind, and the start of projects gets pushed back even further.
Should these symptoms reoccur regularly, your company might need to increase its capacity, improve scheduling, or narrow its services. The earlier you recognize this, the easier it will be to maintain quality and morale.
Connect backlog trends to staffing and scheduling needs
Backlog is not just a scheduling issue; it is a strategic indicator. A growing backlog may mean the business is healthy, but it may also mean your delivery system is close to its limit.
By tying backlog to labor availability and schedule fill rate, you can make better hiring and subcontracting decisions. That helps you maintain control instead of reacting late when jobs start stacking up.
Adjust pricing confidently when demand outpaces capacity
In situations where demand is higher than capacity, price ought to be increased rather than reduced. High prices will help in screening out low-fitting jobs and ensuring profitability in those projects you most prefer.
The reporting will give you the justification to increase prices with more confidence. This is because the data will show high demand, high closing rates, and low capacity.
Build a data-driven growth plan with dashboards and reports
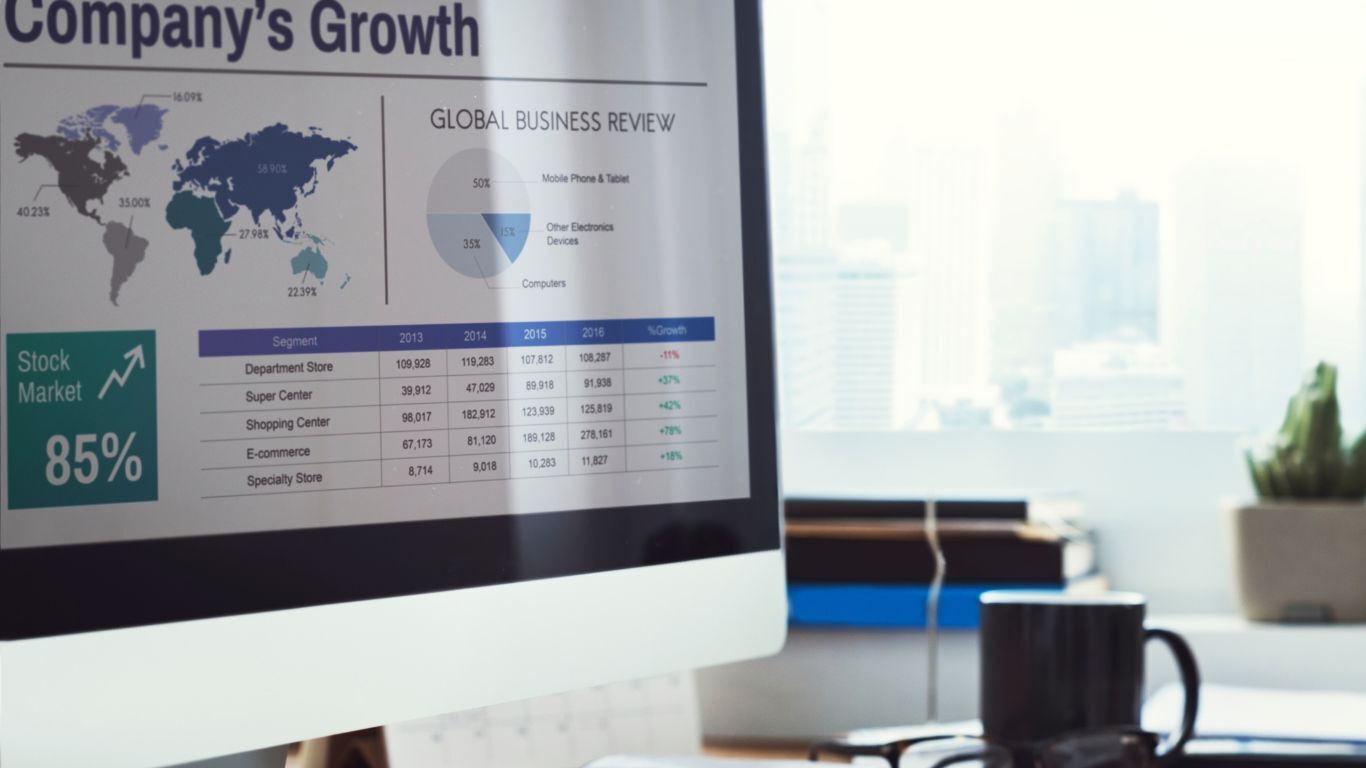
A solid growth strategy begins with the strengths of your company. By using historical data, you can set realistic expectations, find the flaws in your system, and choose realistic goals for the next round.
Rather than speculating about next year's earnings, use reporting as the basis for setting out the future strategy based on actual trends. It changes planning from an abstract forecast to a quantitative exercise.
SCORE’s projections guidance highlights the value of comparing forecasts to real results and adjusting your assumptions over time to keep financial planning grounded in reality.
Set realistic revenue goals based on historical trends
Revenue targets need to consider conversion rate, average job size, seasonality, and ability to deliver. Failure to do so will make the target very good in theory but not in reality.
Historical reporting gives you a better starting point. It shows what the business can reasonably deliver, which makes growth planning more dependable.
Create measurable targets for pricing, marketing, and operations
Utilize dashboards to set tangible objectives for every single area within the organization, such as achieving a certain level of average margin in pricing, high-quality channels in marketing, and on-time schedules in operations.
This approach will make measuring performance much easier and help people realize how they fit into the overall budgeting picture.
Make reporting part of your regular planning rhythm
Reporting works best when it is reviewed on a schedule, not only when something goes wrong. Monthly and quarterly reviews keep small issues from becoming large ones.
If you want reporting to influence decisions, build it into the routine. Review the dashboard, discuss the patterns, and adjust goals based on what the business is actually telling you.
For contractors who want more structure around that process, how to conduct a mid-year business review for contractors can be a practical next step.
Frequently Asked Questions
What should contractor reporting track every month?
At a minimum, report leads, estimates, wins, losses, project type, source of marketing, reason for results, average job price and profit margins per service line. It will provide enough background for understanding the patterns without overloading your team.
How can reports reveal business problems early?
The reports identify problems because they indicate changes in conversion, project type, pricing acceptance, backlog and profitability. These changes occur much earlier than the problem appears in the company’s operations.
Why is a dashboard better than a spreadsheet for contractors?
The dashboard consolidates the relevant information for quick identification of patterns. A spreadsheet is a good tool too, but it is better suited for daily monitoring and decision-making.
How do I use win/loss data to improve pricing?
If you win the same type of job repeatedly, it may show you can increase the price. If you lose it for price reasons, then you have to reconsider your pricing strategy.
What data helps spot capacity limitations in a contracting business?
Consider the following factors: backlog, response time to leads, start-date delays, crew utilization, and job deferrals. A negative trend in these factors suggests you’re close to the point where your team is fully loaded with work.
Recent Articles

October 20, 2026
How to Build Trust Before the First Sales Appointment

October 15, 2026
The Cost of Disconnected Contractor Software

October 6, 2026